As the cost of higher education continues to grow, colleges and universities face increasing pressure to demonstrate student success and the value of a degree to their stakeholders. From a financial perspective, institutions have finite monies that can be used to reduce the cost for students. These monies must be used strategically to increase the yield of a particular type of incoming class of admitted students. Producing a higher yield rate of a competitive incoming class of students can result in an institution’s capacity to serve and retain students, while decreasing the time to graduate and increasing net revenue.
Using admissions, demographic, and financial aid data, the University of Texas (UT) System developed analytics tools that can predict student enrollment, optimize return on investment, and increase net tuition revenue by increasing retention rates.
In order to do this, we started using predictive matriculation models several years ago after the president of a UT research institution put forth a challenge: Maintain the university’s competitiveness, raise the four-year graduation rate 18 percentage points over five years, and increase the diversity of incoming students. Although this seemed like a tall order, we began to methodically consider known indicators of enrollment and retention to form hypotheses that could be applied to existing data. The goal: Determine what the data reveal about students who matriculate and graduate.
We developed a strategy for using known indicators and using statistical methods. Our solution was to use our in-house data to understand how to predict matriculation and retention. We hope that you can benefit from our experience.
What Is Predictive Analytics?
Predictive analytics consists of algorithms created by using historical data and linking that data to a series of outcomes. It is part statistics and part art form. You try to connect puzzle pieces to create a mosaic of your unique campus.
Statistical methods to predict matriculation and student success have evolved over time. For example, methods include crosstabs in Excel, correlations, mean differences, cluster analyses, and logistic regressions.
In a perfect world, you need about five to 10 years of data on which to base your model. Ideally the information is held in data warehouses. The amount of data that you need could vary with the size of your institution. With fewer students, you might need more historical data to build your model. However, using several years of data can be challenging if policy changes that impact the data have taken place.
A vital component of your approach will be getting the right people in the room. We realized that the offices of institutional research, admissions, registrar, financial aid, and accounting housed abundant data, so we facilitated a gathering and got data-sharing commitments.
If you want to predict whether a student will accept admission and enroll at your university, you must have historical data on the factors that are important in student matriculation. While we think that the following factors are important, only you can establish if they are determining factors on your campus. Your model will differ depending on your students and your institution.
Note that we make a distinction between those who applied and those who were admitted, versus those who matriculated. In this case, we are talking about those who were admitted and how we can influence them—decisions that impact yield:
- Cost.
- Financial aid.
- Academic reputation.
- Institution size.
- Recommendations from family and friends.
- Geographic setting.
- Campus appearance.
- Personalized attention prior to enrollment.
For instance, at some institutions, geographic setting has a significant impact because students who live closer to the campus are more likely to matriculate than those who live further away. Each campus has its own culture and focus so different factors matter for different campuses.
A Research University Case Study
Let’s take a look at the case study of the large research university within the UT System that started us on this venture. After the president’s challenge, increasing the four-year graduation rate and shaping incoming classes became two major focuses.
At the time of our predictive modeling, the campus had 33,000 applications a year, with 15,000 admitted, for a 43-percent yield rate. The number of applications continues to increase each year. Yield rate remains about the same. The institution is very competitive: 72 percent of the students admitted in the fall are in the top 10 percent of their high school class and the average SAT score is 1260. About 36 percent of the students are underrepresented minorities, not uncommon for Texas.
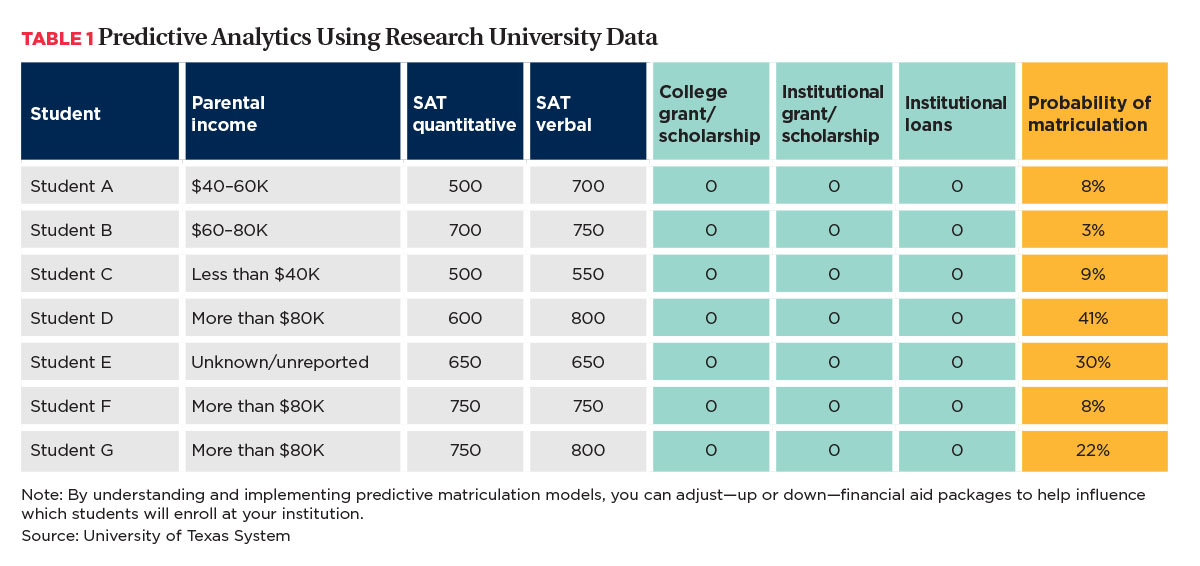
We have always employed predictive analytics, even if we called it research or another term. Knowing that we had no easy button to push to increase graduation rates, we compiled data for the past 10 years on those students who were admitted. We then predicted the likelihood of their showing up on the census data (i.e., 12-hour class days). As shown in Table 1, we included multiple variables of interest: SAT quantitative, SAT verbal, parental income, college grants or scholarships, institutional grants/scholarships, and institutional loans.

In this example, the data reveal that without any sort of financial aid, the probability of matriculation ranges from 3 percent to 41 percent for these seven students. Student A, whose parents report an annual income of $40,000 to $60,000, has a high 700 on his verbal SAT. Student A has an 8 percent chance of enrolling.
Student B, whose parents earn between $60,000 to $80,000, has high SAT scores. Because we really want this student, we decide to offer her $5,000 in college grants, $5,000 in institutional grants, and $10,000 in institutional loans. Previously, this student had a 3 percent chance of showing up. Now, the probability of matriculation of Student B increases to 35 percent.
Now let’s look at Student D and give him the same amount ($5,000/$5,000/$10,000). His probability of matriculation increases from 41 percent to 72 percent.
If Student F receives the same offer, her probability jumps from 8 percent to 24 percent, which is still below the 53 percent to 62 percent threshold that this university has set as a goal for its probability of matriculation.
Now suppose we reduce the grant aid to $1,500 ($5,000/$1,500/$10,000) for Student D, who is at a high 72 percent. The probability of matriculation becomes 65 percent, which is still within the desired threshold. Then we can apply that $3,500 to Student E, who also qualifies for a $10,000 loan. Now Student D’s probability of matriculation bumps up to 47 percent from 30 percent.
We are still not happy with the 35 percent probability for Student B, making it likely that this student will go elsewhere, so we decide to reduce the institutional grant to $2,500, dropping the probability even further to 26 percent. We give that $2,500 to Student E, whose probability of matriculation increases to 52 percent.
This is an example of how you can strategically alter your aid offer to increase matriculation probabilities and meet your desired threshold. You want to maximize the finite dollar amount of financial aid resources that are available for incoming students.
A word of caution, however: More loans aren’t always the optimum answer. High institutional loans can have an adverse effect because risk-adverse students worry about paying them back.
There is no standard universal algorithm for predicting the probability of matriculation. Every institution has to do the work to determine the statistically based analytics model that can predict matriculation, maximize return on financial aid resources, and increase retention. As each year passes, the model will become stronger based on additional data.
The model is never static. You can drop off older years as they become less representative of your student population.
Retention and Graduation
Because it costs an institution of higher education more to recruit than retain students, we reasoned that evaluating data patterns to indicate success (retention) would be time well spent. According to the 2002 study, The Psychology Underlying Successful Retention Practices by John Bean and Shevawn Bogdan Eaton, factors influencing retention and graduation include:
- Background. How much do the student’s parents earn? Has the student achieved precollege academic success?
- Organizational. Does the institution offer orientation programs? Do students find it easy to register and get the desired classes?
- Academic. How are the student’s study skills? What level of advising is offered? Is absenteeism an issue?
- Social factors. What is the peer culture like? Is the student socially involved?
- Environmental. Is the student married? Does he or she have a job off campus?
- Attitudes and intentions. Is the student self-sufficient? Is he or she motivated to succeed?
Since we may not have access to data in all of these areas, we sometimes have to be inventive in capturing data. For instance, to capture study skills, we might count card swipes at the library. We need to be creative and look at new ways that serve as a proxy for factors that have an impact on retention and graduation.
Some early indicators for student success are highly correlated with academic preparedness; others relate to financial background. We suggest that you create an inventory of your campus data and test to see whether they are a significant predictor. A bit of trial and error is involved to figure out predictors that may or may not have an impact on your campus.
Further, by including different variables and taking out others, you may discover that some variables work together, interacting in a different way from what they would on their own. To achieve a robust model takes an iterative process.
A Doctoral University Case Study
Now let’s look at a UT doctoral university that at the time of modeling averaged 15,000 applications, with 11,000 admitted, for a 45-percent yield rate. Classified as a Hispanic-serving institution, this university had a 1060 average SAT score.

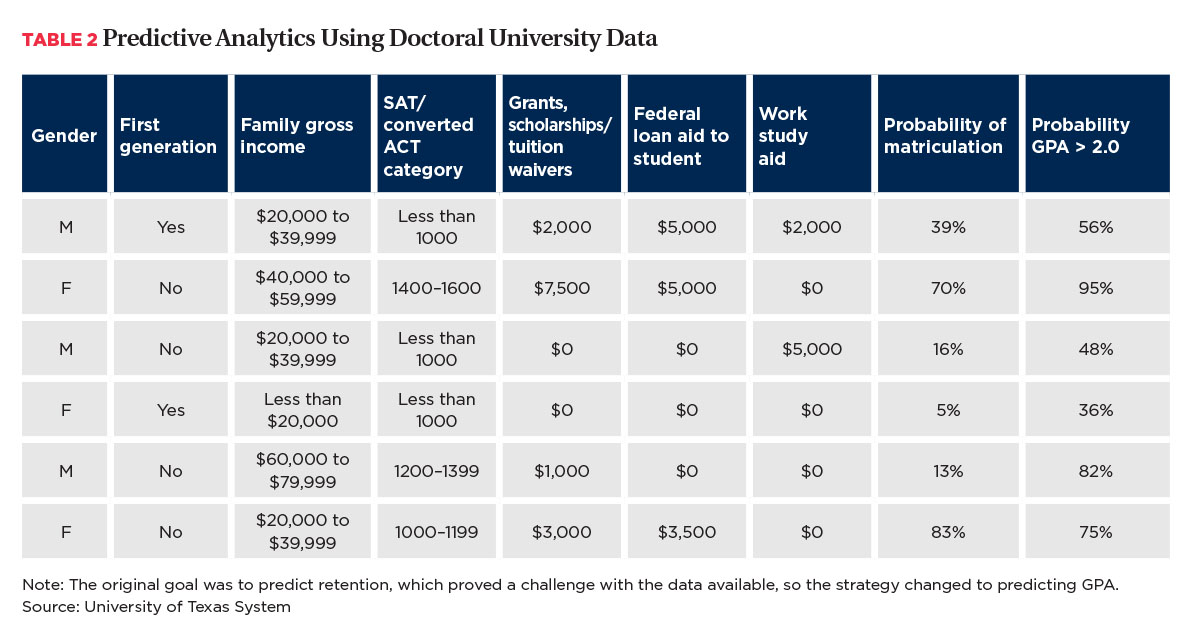
Table 2 is based on the data of a UT doctoral university with higher research activity, 24,462 undergraduate students, and 4,976 first-time-in-college (FTIC) students for the summer/fall. The data are limited to 2010 to 2013 cohorts because earlier years of financial aid offers were not recorded. The data set includes 36,924 FTIC students and excludes transfer students.
Of particular interest to this institution was the category “Grants, Scholarships/Tuition Waivers.” With a high population from nearby military bases, tuition waivers (lower published prices for a targeted population such as active military, veterans, civil servants, seniors, etc.) have a high degree of influence.
Accuracy of Models
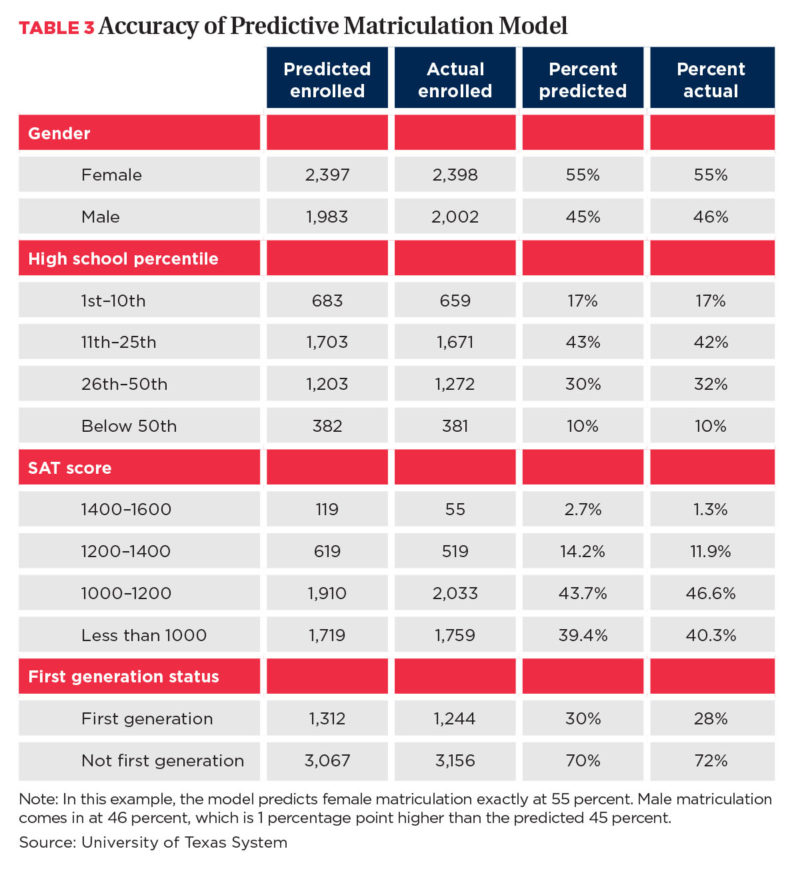
Just how accurate are predictive matriculation models? Obviously, they vary with the integrity and size of the data set. The model used in Table 3 was spot on in determining the size of class, as well as the characteristics and distribution of the classes.

Advice Based on Experience
Based on our six years of experience with predictive matriculation models at UT System, we offer the following advice to business officers:
- Adopt a data-sharing approach. If people own their data and don’t share them, they can shed only one light on a data point. Get the right people in the room, such as the admissions office, financial aid, registrar, bursar, institutional research, and encourage back-and-forth communication. These people can provide knowledge about historical data and policy changes. The context each of these data stewards can provide is invaluable. For example, suppose your institution had an admissions policy change several years ago. That information, which admissions would know, would have to be factored into modeling.
- Create a safety net for students. Suppose two students—Sue and Bill—both have a 65 percent likelihood of retention. Although they should never see that metric, you should be aware of it before they set foot on the campus. You can distribute that information to student services and other offices to create a safety net so that they don’t fall through the cracks. You should also make Sue and Bill aware of the resources and services available to them.
- Identify risk groups and strategies for communicating acceptance letters. If you have a student with a low likelihood of retaining, you can send an acceptance letter saying, “Welcome to XXX University. We are so excited to have you. Here are programs you might be interested in pursuing.” Then give that student ID to different organizations so that you have that wraparound effect.
- Examine treatment variables on retention and graduation. Make sure that you have documentation and assessment built into your model so that you can see whether the variables are having the desired impact.
- Understand and keep your historical data. We discovered that once aid has been dispersed, some institutions replace offer information with the actual aid awarded. Offer information is critical because students make their matriculation decisions based on it. Be sure to keep the original package.
- Track the success of institutional aid dollars. Check to see whether particular students were retained or graduated. Let’s say 65 percent proved to be the optimum probability of matriculation for students who were retained and successful at your institution. That’s an important metric to know. Now you have a baseline to measure future aid. You can also see the flip side of that equation: Financial aid lost to attrition. How many millions of dollars were applied to students who weren’t successful? How can you prevent that in the future?
Open Doors of Opportunity
Once you have developed your model, you will find that stabilizing your incoming class size will allow you to obtain a good metric for forecasting housing, food, student services, advising, and tutoring needs.
You will also be able to estimate your net tuition gain. By keeping students and graduating them, you open the doors of opportunity for additional new students. As students move more smoothly through the education pipeline, opportunities open up for more students at your institution.
Marlena A. Creusere is senior research and policy analyst, and David R. Troutman is associate vice chancellor, institutional research and decision support, University of Texas System.


