Net assets, the difference between assets and liabilities, is an important measure of a college’s capacity and viability. As such, it is a useful indicator of the resources available to support the institution’s mission and strategic objectives.
This study updates a previous Business Officer article (“A Vital Statistic,” November 2013), that analyzed changes in net assets of private colleges between 2000 and 2010. This new analysis covers 2005 through 2015, a decade that includes the Great Recession of 2008–09 and the subsequent economic recovery.
The article examines 314 institutions that (1) were ranked in U.S. News and World Report’s America’s Best Colleges, in both 2005 and 2015; (2) reported net assets of at least $100 million and FTE students (undergraduates and graduates) of at least 500, in 2005; and (3) annually reported in the IPEDS survey all metrics used in this study. All dollar amounts used in the article are nominal and not adjusted for inflation; a year refers to a fiscal year; “colleges,” “schools,” and “institutions” refer to private four-year and graduate-level colleges and universities; and “enrollment” and “per student” are reported on an FTE basis.
To explore whether factors that explain net asset growth are more easily revealed based on size, the institutions are disaggregated into the following groups:
- High—88 colleges with net assets greater than $500 million.
- Medium—98 colleges with net assets between $200 million and $500 million.
- Low—128 colleges with net assets between $100 million and $200 million.
 Additional analysis stratifies the above categories into bottom and top tiers to identify possible causes of observed results.
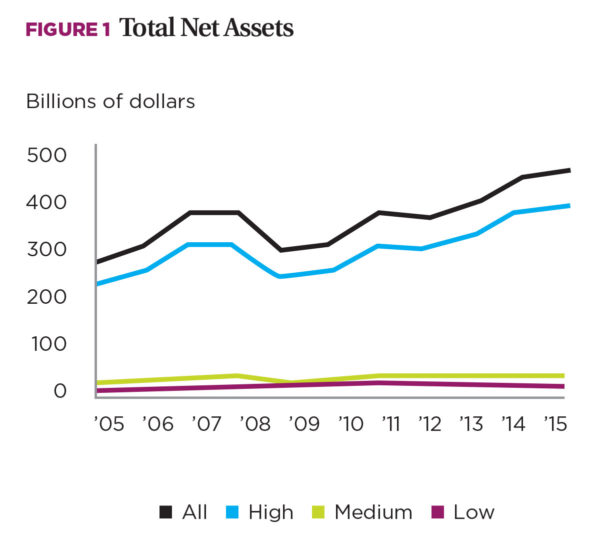
In general, for all 314 colleges, total net assets increased from $274.2 billion in 2005 to $456.6 billion by 2015, an average annual increase of 5.2 percent. In comparison, total net assets for all corporations listed on the New York Stock Exchange, as measured by total shareholders’ equity, increased at a higher but similar 6.3 percent annually over the same period. Figure 1 illustrates total net asset growth and how the overall 5.2 percent net asset growth for institutions compares across the high, medium, and low size stratification.
Over the 2005 to 2015 period, the average annual changes in net asset growth were roughly similar for the three size categories—5.3 percent for high, 4.8 percent for medium, and 4.7 percent for low.
 Differing Rates Within Groupings
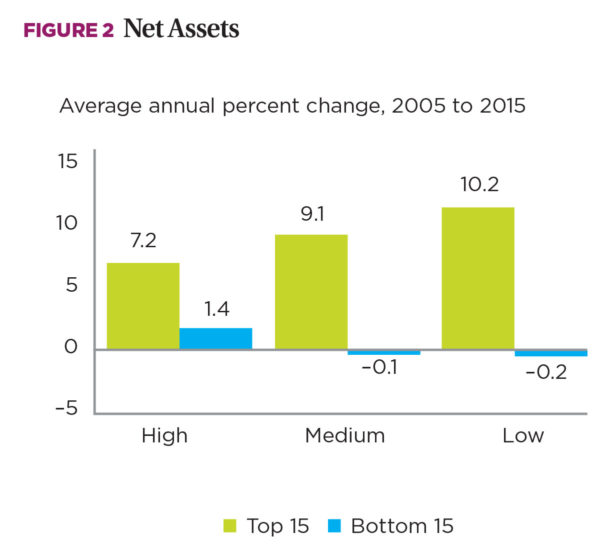
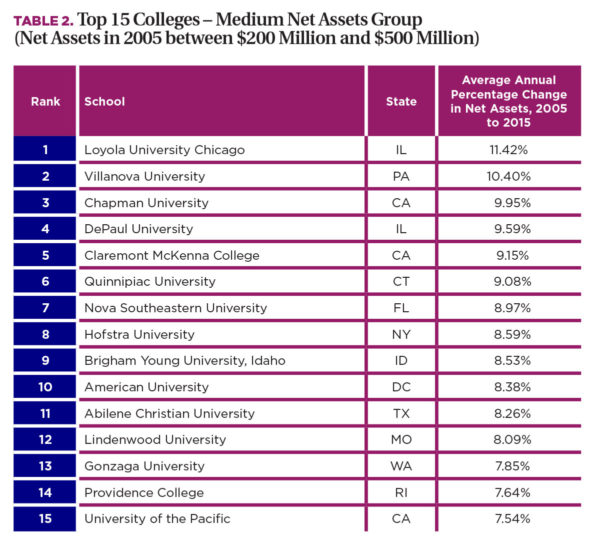
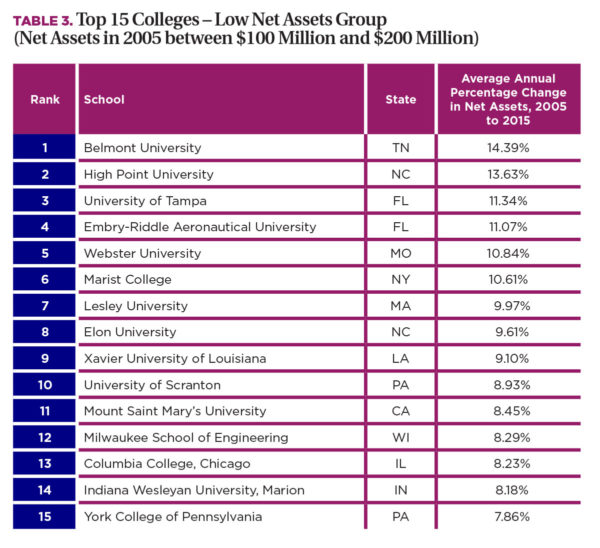
Although there appear to be relatively small differences in the overall growth rates of net assets for various sized schools, there are sharp differences within each of the net asset groupings. Figure 2, for example, shows a remarkable difference in net asset growth between the top and bottom 15 colleges within each of the high, medium, and low categories; across the board, the bottom 15 had relatively flat growth. (For a list of the top 15 colleges in each category, see Tables 1, 2, and 3.)

Influential Factors
These observations point to performance differences between the top and bottom tiers in each of the three size categories; some schools (top 15) are doing well in generating net assets, while others (bottom 15) are not. What accounts for the high net asset growth of some schools and the low or negative growth of others? In essence, what are the factors that lead to higher or lower net asset growth?
This study addresses these questions, at least in part, by looking at enrollment and financial statement elements reported by the colleges to IPEDS, and comparing changes in those items to net asset growth in various college groupings. This article examines the following items:
 Enrollment.
- Tuition revenue and related expenses.
- Nontuition-related revenue and expenses.
- Net assets and changes in the balance sheet.
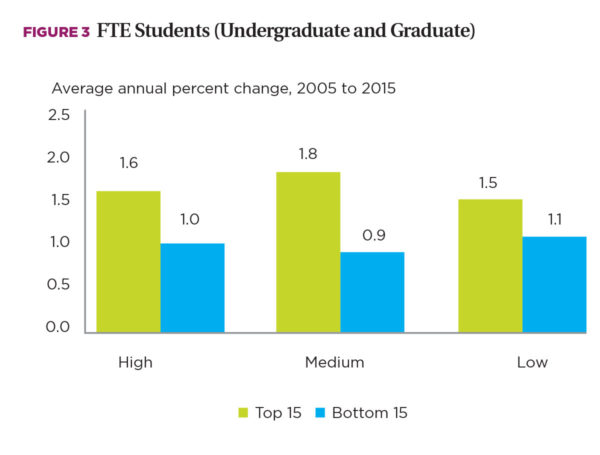
Enrollment. Figure 3 shows that the total of undergraduate and graduate student enrollment on an FTE basis for the top 15 in each size category grew, on average each year, about a half percentage point more than did the bottom 15 schools in the high and low net asset categories, and almost a full percent more than did the medium net asset schools.
Given these differences in enrollment growth for the top- and bottom-performing schools, it will be helpful to analyze key revenue and expense items on a per-student basis. This makes it possible to focus on the specific impact of the income statement item being analyzed rather than its combined impact with enrollment changes.
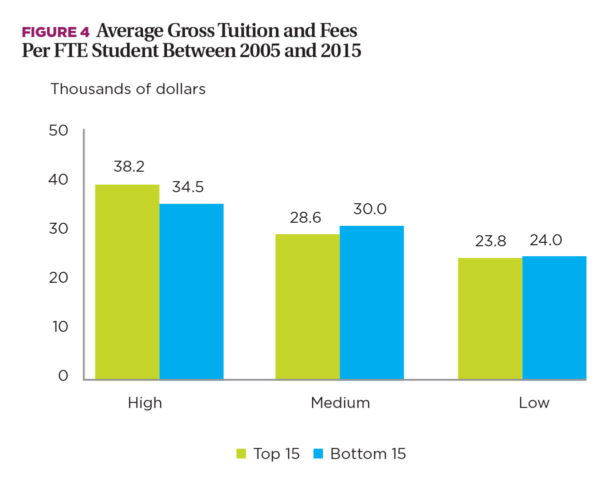 Tuition revenue and related expenses. Figure 4 shows average gross tuition and fees per FTE student (undergraduate and graduate) over the 2005 to 2015 period. (Gross tuition and fees are the prices charged to students.) The average tuition rate for the top 15 high net asset colleges is about $4,000 higher than that of the bottom 15. For medium and low net asset schools, the differences between the top and bottom 15 are relatively small.
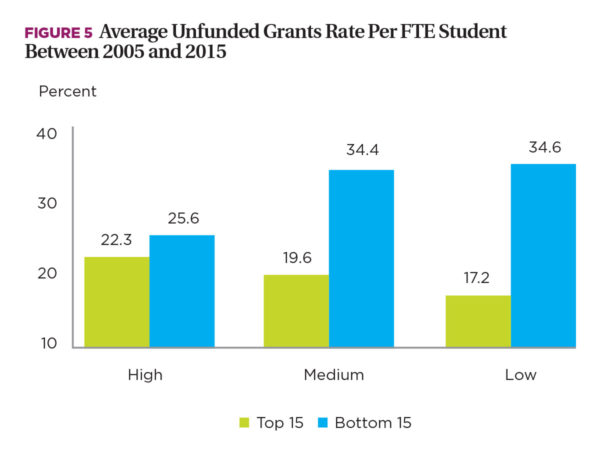
- Unfunded institutional aid. Much more striking are the differences in which colleges used unfunded grants (general unrestricted or undesignated resources) to reduce tuition charged to students. (Unfunded grants to students make up a portion of the total “discount” or institutional aid provided to students; institutional aid or grants reduce gross tuition to a net tuition amount.) As Figure 5 illustrates, average unfunded grant rates per student increased between 2005 and 2015 for the bottom 15 colleges across all net asset groups. However, the increase was most dramatic for the bottom 15 in medium and low net asset colleges.
- Total institutional aid. Funded institutional grants for tuition (which come from endowments that are either externally restricted or internally designated for student aid) comprise the remaining portion of institutional grants. Funded aid is also higher among the bottom schools in all three size categories—especially for the bottom 15 colleges within the high net assets category, likely as a result of substantial endowment values at high net asset institutions.
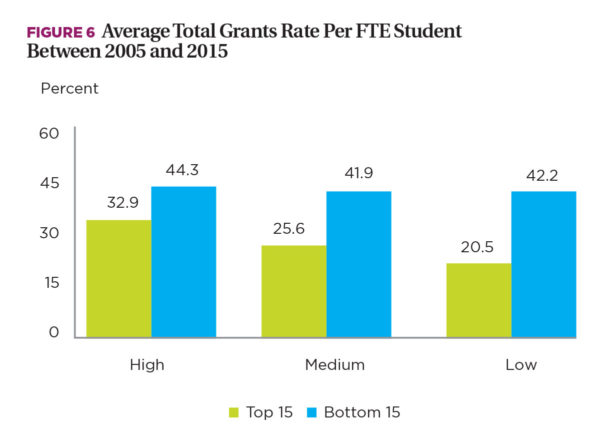
Combining unfunded and funded grants shows the extent to which the bottom 15 schools discount their gross tuition levels, in the aggregate. This is especially pronounced among low net asset schools, where the bottom 15 colleges had a total discount rate of 42.2 percent (unfunded plus funded aid awarded to students). As Figure 6 shows, this high discount rate is more than double the average total grants of 20.5 percent awarded by the top 15 colleges in the same size category.
These trends in the awarding of institutional aid (funded and unfunded) explain why net tuition per student is lower in the bottom 15 (averaging $13,300 to $19,400) as compared to the top 15 (averaging $18,700 to $25,600) in all three size categories.
- The connection between net tuition and education expenses. Net tuition revenue can be related to the functional categories of expenditures that include instruction, academic support, student services, and allocated overhead. Average educational expenditures per student (as shown in Figure 7) are higher for the top 15 than the bottom 15 in the high net asset category, but they are lower for the top 15 in the medium and low net asset categories.
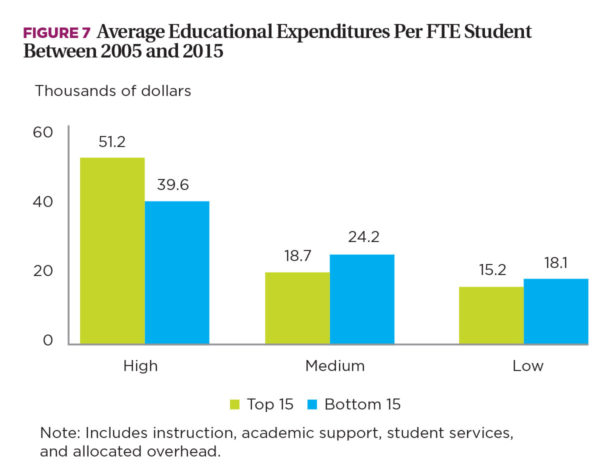 The reason for this seemingly anomalous result is that the top 15 colleges in the high net asset category spend significantly more in instructional costs. Of the $51,200 educational expenditures per student for the top 15 colleges in the high category, $36,300 comprises instructional costs. That compares to only $27,800 in instructional costs for the bottom 15 in the same size category. In contrast to this, the top 15 colleges in both the medium and low net asset categories spent less in instructional costs per student than the bottom 15.
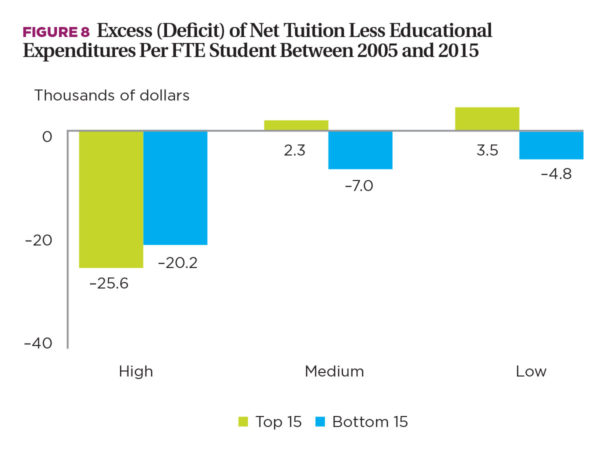
Figure 8 presents the excess (deficit) of net tuition after educational expenses are subtracted. Except for small excesses for the top 15 medium and low net asset colleges, the margins are negative. On average during the 2005 to 2015 period, the top 15 colleges in the high asset group had a deficit of $25,600 per student, while the bottom 15’s deficit was $20,200. In the medium and low size categories, the top 15 barely broke even, while the bottom 15 had deficits of $7,000 and $4,800 per student, respectively.
 Nontuition related revenue and expenses. Other revenues and expenditures must be considered in deriving something closer to a bottom-line surplus or deficit.
Sources of nontuition revenue include contributions (gifts), investment returns, government grants and contracts, and auxiliary service fees. Because educational expenditures generally exceed net tuition, other forms of support such as contributions and the portion of investment (endowment) returns that fund institutional aid are needed to make up this deficit. Holistically, all nontuition revenue must be examined against major categories of expense—such as institutional support and research. (Auxiliaries—the revenue and expense related to housing, food, bookstores, parking, and so on—tend to be very close to self-supporting. Consequently, net auxiliary operations are not discussed in this review of net asset growth drivers. In addition, this analysis does not include hospitals or other independent operations.)
- Institutional support. This support includes expenditures related to the operations of the institution, such as executive management, legal and fiscal operations, human resources, purchasing and printing, public relations, development, allocated plant operation and maintenance costs (including depreciation and interest), and so forth. Larger colleges spend almost twice as much on institutional support per FTE as medium and low net asset colleges do—perhaps due to increased costs to support centralized financial operations and technology infrastructure, investment strategy and operations, endowment reporting and donor relations, research accounting and compliance, and much larger physical plants. Although there is little difference between the top 15 and bottom 15 for the high net asset group, the top 15 medium and low asset schools spend less per student on institutional support.
- Research expense. Not surprisingly, larger colleges spend significantly more on research per FTE than smaller colleges. The top 15 schools in the high asset category spend on average $23,100 per student; for medium and low net asset schools that number averages from $100 to $1,200 per student.
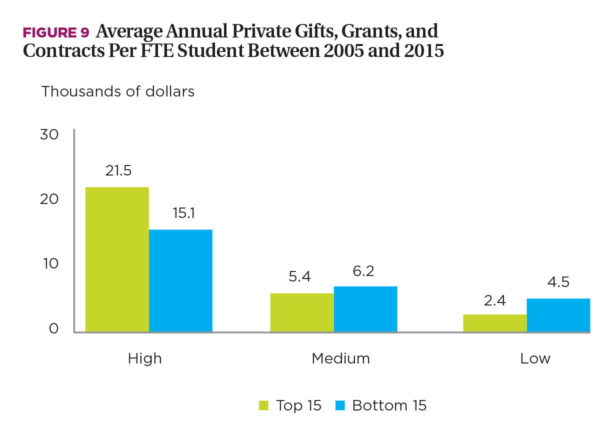
- Private gifts, grants, and contracts. As can be seen in Figure 9, gift revenue per student is a significant revenue source for high net asset schools, particularly the top 15. Gifts per student are less pronounced for medium and low asset schools. Another difference, when compared to high net asset schools, is that the bottom 15 generated higher average gift revenue per student in both medium and low categories. Considering the much higher discount rates among the bottom 15 institutions in this category, it’s plausible that this support is continually used for student financial aid, and is therefore vital to financial sustainability.
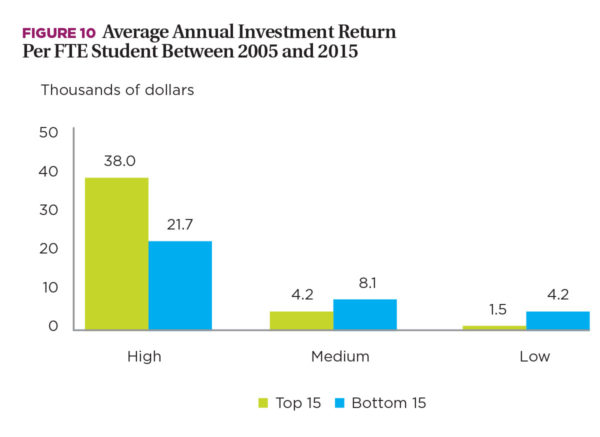
- Investment earnings. An even more significant offset to the bottom line than gift revenue for high net asset schools is investment earnings. These earnings represent the income from assets, including dividends, interest earnings, royalties, rent, gains (losses), and so forth. Almost all this revenue is generated by endowment assets on the balance sheet.
Since endowments are significantly larger at high net asset colleges, it is not surprising that their investment return per student, shown in Figure 10, is significantly greater than that of medium and low net asset schools. But, as in the case of gift revenue, the bottom 15 medium and low net assets colleges experienced higher annual returns per student than the top 15 schools—which is vital to sustaining the high institutional aid growth in this category.
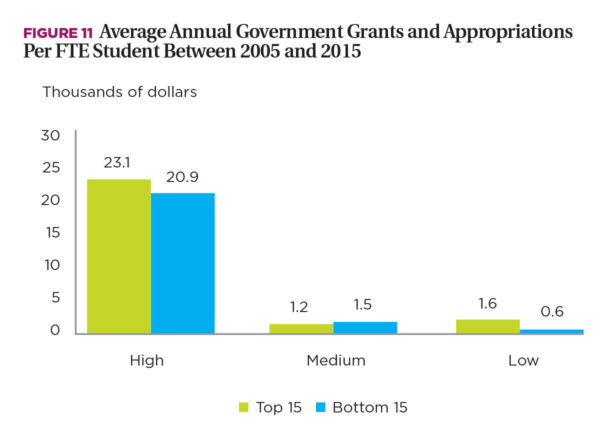
- Government appropriations, grants, and contracts per student. Figure 11 reveals that government grants enter significantly as a source of nontuition revenue for high net asset colleges, but not so for medium and low-sized schools. This is in large part due to higher federal research grants awarded to larger colleges. In addition, there appears to be little difference in government grants between top and bottom 15 colleges.
 Net assets and changes in the balance sheet. The net difference between revenues and expenditures for the income statement items described earlier explain most of the changes in net assets per FTE student between 2005 and 2015 shown in Figure 12.
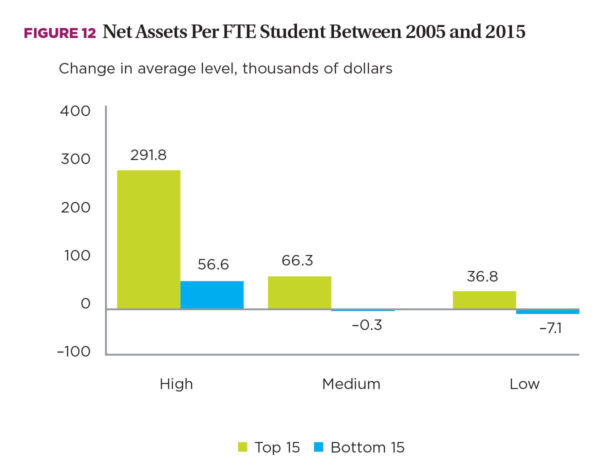
Most of the changes in net assets enter the balance sheet in two categories: endowment and property, plant, and equipment.
- Endowments. For endowments, the study found that changes from 2005 to 2015 reflected key differences: For the top 15 in the high net asset category, growth averaged $296,000 per student for the top 15 versus $77,000 for the bottom 15. In the medium net asset schools, the top 15 schools experienced a gain of $38,000 per student as compared to a slight decline of –$1,400 for the bottom 15. The low end of the net asset schools showed a gain of $11,000 per student for the top 15 while the bottom 15 gained only $3,000.
- Property, plant, and equipment. In the areas of property, plant, and equipment, differences were also evident, but the gaps were not as wide. The increases in the level per FTE student between 2005 and 2015 for the top 15 were $92,000, $43,000, and $39,000 in the high, medium, and low colleges, respectively. The bottom 15 increases were $76,000, $42,000, and $24,000, respectively.
Debt can also be used to fund asset growth. For example, while a college can fund the construction of a new building through gifts, it can also do so by borrowing the required funds, thereby increasing total liabilities.
The changes in liabilities per FTE student between 2005 and 2015 are shown in Figure 13.
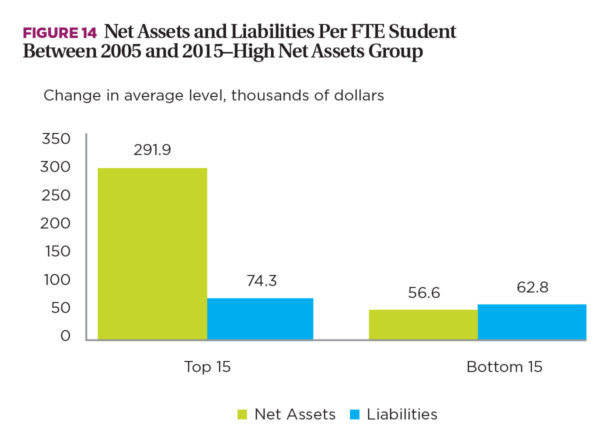
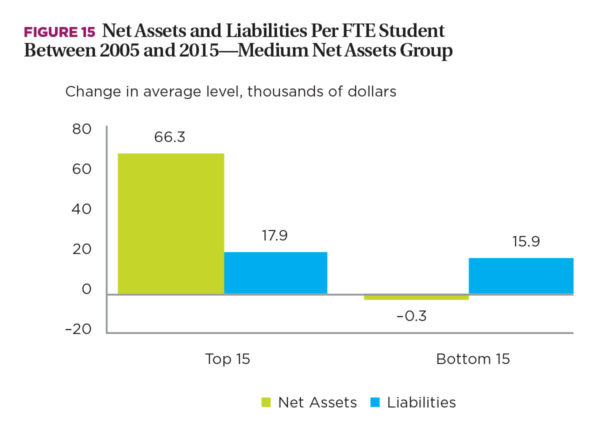
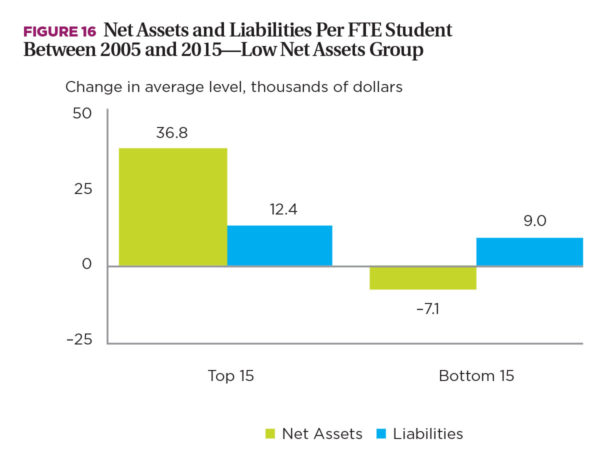
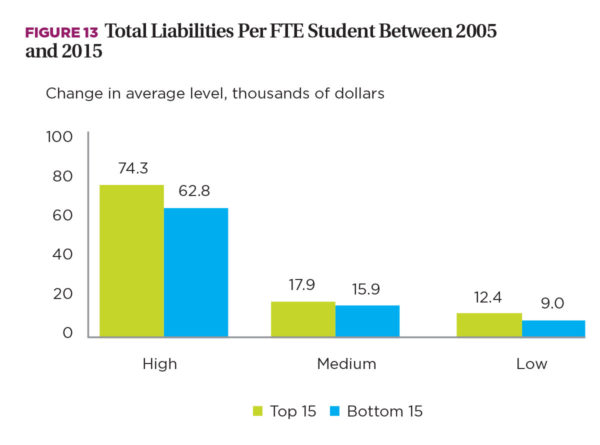 Given the greater positive operating performance of the top 15 colleges when compared to the bottom 15 in each size category, it is not surprising that higher student growth of these schools, coupled with their greater borrowing capacity, led to their marginally higher growth in liabilities. The bottom 15 colleges in all size categories have more limited borrowing capacity because of their weaker operating results. Nonetheless, these colleges still have needs to maintain or enhance their campuses. But, because of their weak net asset growth, even though their borrowings are lower than the top 15 performing colleges, the bottom 15 schools’ borrowings are outstripping their capacity to fund these debts. That can be seen in Figures 14 through 16, which show that net assets are increasing more rapidly than liabilities for the top 15 schools in all three size categories. For the bottom 15 schools, however, liabilities are increasing faster than net assets, especially for the low net asset schools, where net assets are actually declining.
Summarizing Study Findings
The study of net assets suggests that the top 15 colleges experienced more rapid net asset growth as a result of the following factors:
- The top 15 in all three net asset categories increased enrollments at faster rates.
- The top 15 in all three net asset categories limited their increases in the unfunded grants rate, thereby increasing net tuition more than did the bottom 15 schools.
- In the medium and low net asset groups, the top 15 experienced lower educational expenditures per student.
- The top 15 high net asset schools brought in more gifts, investment returns, and government grants on a per-student basis than the medium and low net asset colleges.
- The top 15 medium and low net asset schools brought in less gift and investment revenue on a per-student basis than the bottom 15 colleges. This relatively better performance in attracting nontuition revenue on a per-student basis for the bottom 15, however, was not enough to offset their steep operating line losses. These losses appear to be caused mainly by high rates of growth in unfunded grants.
- The top 15 high net asset schools increased endowment per student significantly more than all other schools. These top 15 high asset schools also increased their investments in property, plant, and equipment. But the differences in these investments among different size categories were not as great as those in endowment.
- The top 15 colleges in all three size categories increased their average debt levels more than the bottom 15 did. This reflects the greater borrowing capacity of schools with a more positive operating performance. But in spite of the more limited borrowing capacity of the bottom 15 colleges, they continued to add to their average debt levels. More ominous regarding the ability of these colleges to fund their high debt in the future is the fact that liabilities increased faster than net assets in all three size categories for the bottom 15 schools.
Institutions can take into account these findings when developing their strategic plans. A useful exercise in facilitating such planning would be to compare the particular college’s performance over the 2005–15 period to the overall averages for the top- and bottom-performing colleges, as presented in this report.
To see how tuition pricing, expenditures, and nontuition revenues lead to different net assets outcomes, two actual colleges can be compared using IPEDS data. One of those colleges is a medium-sized school in the top 15 that increased its net assets by $506 million or 158 percent between 2005 and 2015. The other school, which is neither a top- nor a bottom-performing school, increased its net assets by $84 million, an increase of 31 percent. So, what happened between 2005 and 2015 that led the top 15 college to increase its net assets by $422 million ($506 million less $84 million) more than the non–top 15 school?
In spite of the significant difference in net asset growth between 2005 and 2015, both schools looked fairly similar in 2005 (see Table).
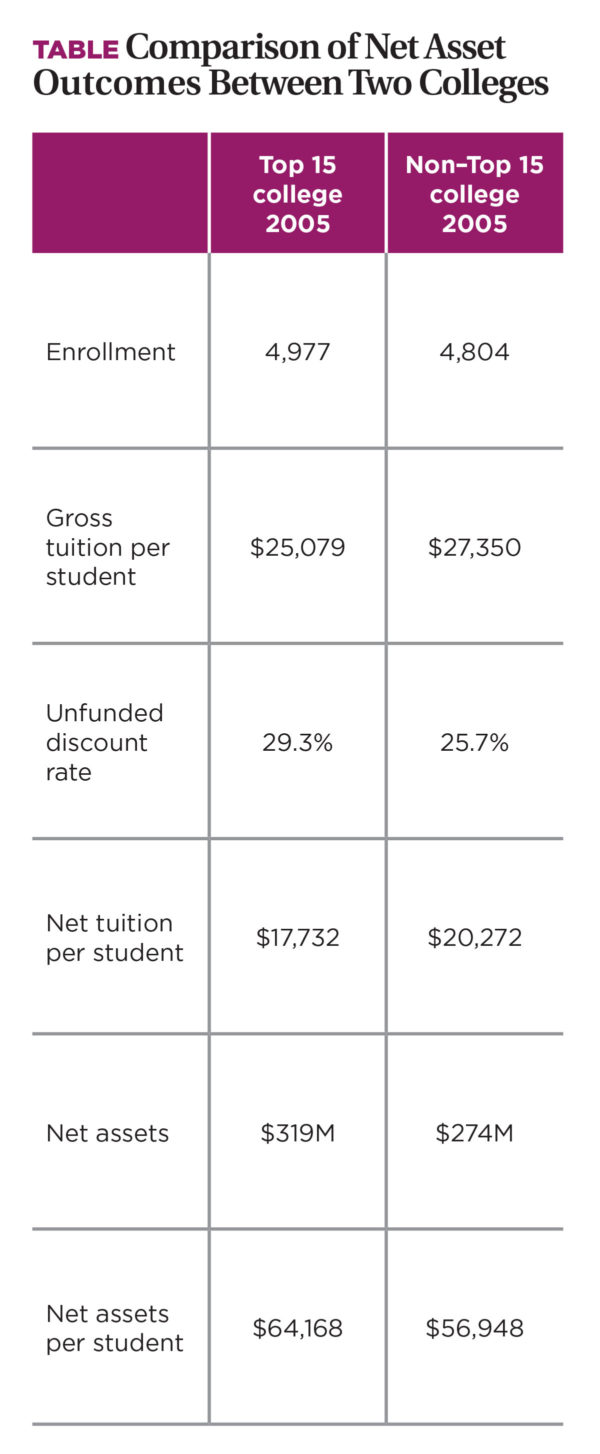 After 2005, however, the most significant thing that happened is that the top 15 college increased its enrollment at an annual average rate of 4.4 percent versus 0.7 percent for the non–top 15 school. Another factor explaining the significant difference in net asset swings is the unfunded discount rate. The top 15 college increased its unfunded grant rate from 29.3 to 32.1 percent, as compared to a higher increase from 25.9 percent to 33.2 percent for the non–top 15 school. As a result, net tuition (after unfunded grants) for the top 15 school was about $2,000 higher per student in 2015, instead of $2,500 lower as it was in 2005. That alone represents a swing of $4,500 per student.
In addition, the top 15 college generated $3,800 more in gift revenue, on average, per student between 2005 and 2015 than the non–top 15 school.
These differences in net tuition and gifts explain almost all the $421 million variation in net asset growth between the two schools.
The true significance of the greater net asset growth on the part of the top 15 college is reflected by the way it deployed its assets to support its mission and strategic objectives. A look at the balance sheet sheds light on this. The top 15 college increased its endowment by about $50 million more than did the non–top 15 school. More significant was the fact that the top 15 college’s investment in property, plant, and equipment increased by $488 million versus $116 million for the non–top 15 school—a difference of $372 million. These two differences ($50 million and $372 million) account for the $421 million difference in net asset growth between the two colleges.
It is beyond the scope of this study to explain why the top 15 college had the tuition pricing power to increase its enrollment, while exhibiting greater control over its unfunded discounts. But one thing seems clear: The ability to increase net tuition and gift revenue allowed for the increase in net assets. That, in turn, provided the financial wherewithal to invest more heavily in endowment and physical plant, thereby giving the college a more competitive edge in the marketplace.
Net assets clearly matter. They are the mirror that reflects the resources a college has at its disposal to support its mission and strategic objectives. Focusing more attention on net asset growth will, in turn, point the way to more optimal decisions regarding enrollment, net tuition pricing, and strategies relating to sources of nontuition revenue.
JAMES L. DOTI is president emeritus and Donald Bren Distinguished Chair of Business and Economics, Chapman University, Orange, Calif.


