Global political upheaval inevitably affected the world’s financial markets in FY17. Britain’s unprecedented vote in late June 2016 to leave the European Union (“Brexit”) and the subsequent resignation of Prime Minister David Cameron led to an immediate drop in global equity prices and a depreciation of the British pound.
After the Brexit vote outcome became clear, the U.S. stock market had its steepest drop in 10 months, and the Japanese Nikkei 225 index had its steepest drop in 16 years. While world markets recovered and stocks continued to rise after Donald Trump’s election to the U.S. presidency in November 2016, the election thrust U.S. domestic politics into a state of flux, continuing to the present.
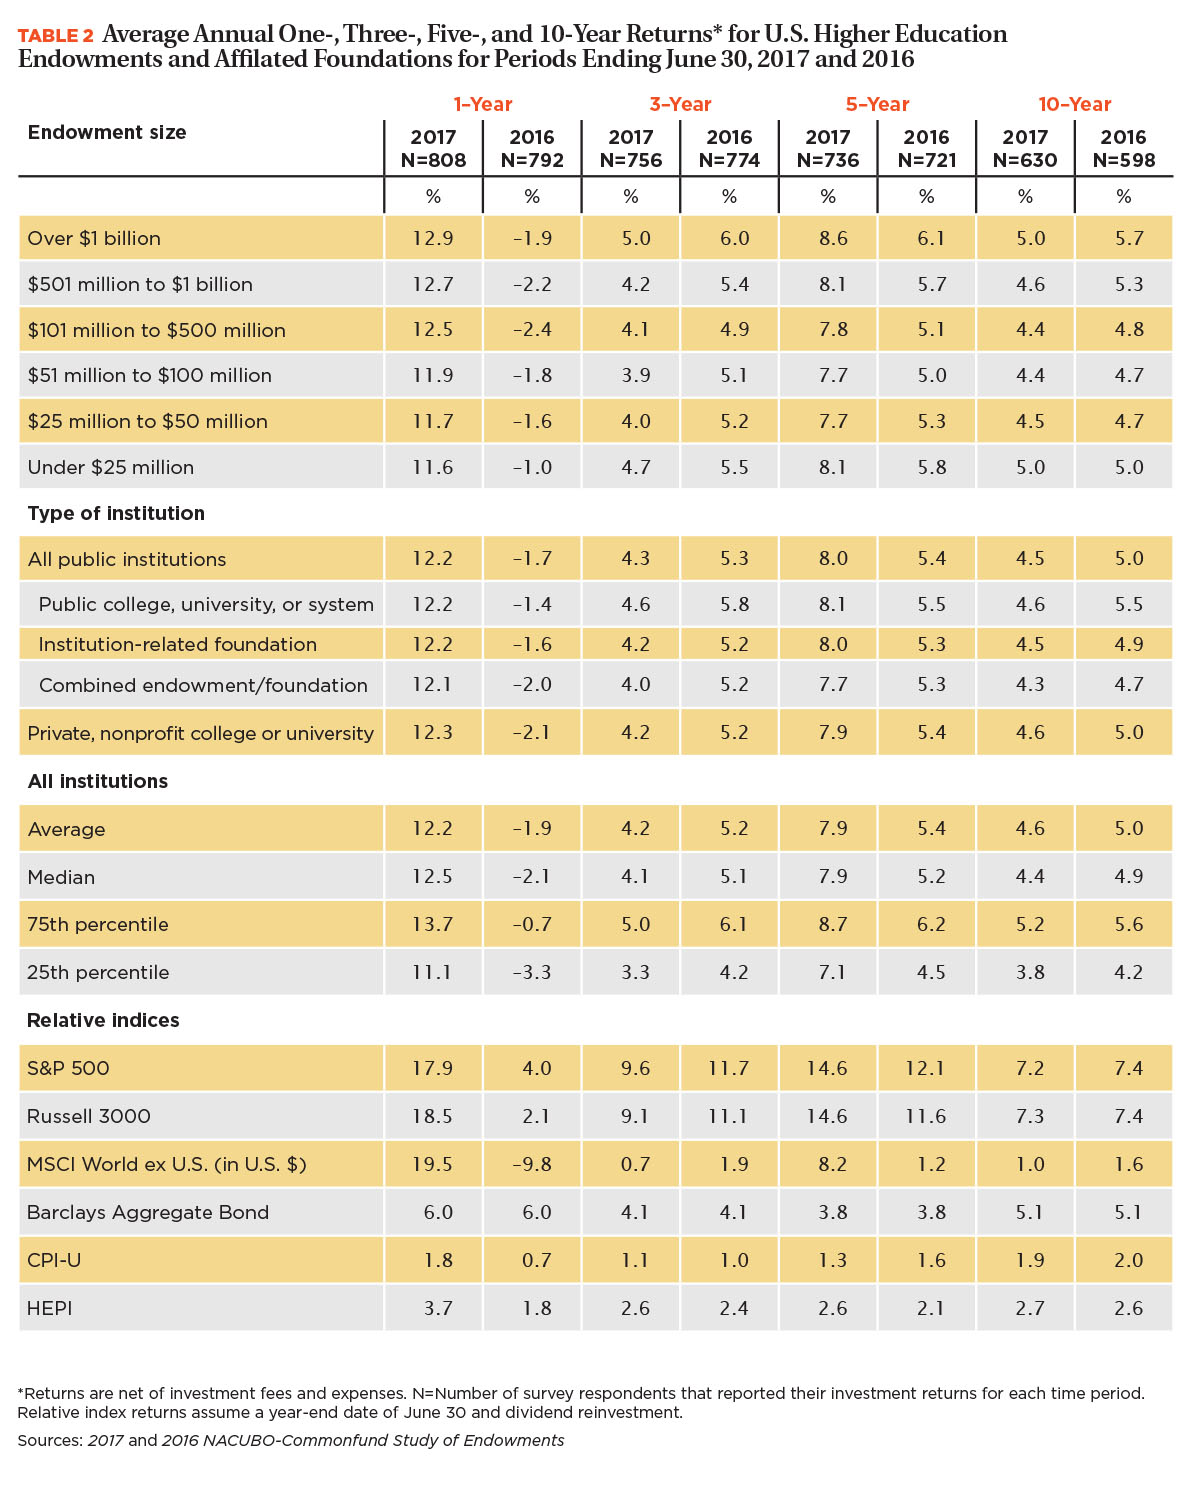
Amid this turmoil, college and university endowments seesawed sharply from an average return of –1.9 percent (net of fees) in FY16 to an average return of 12.2 percent (net of fees) in FY17, according to the 2017 NACUBO-Commonfund Study of Endowments (NCSE). The FY17 one-year average return, however, was much stronger than the 10-year average return that institutional endowment managers use to plan investment and spending strategies over time. In FY17, the 10-year average net return dropped to 4.6 percent from FY16’s 5.0 percent; the FY17 three-year net return of 4.2 percent was also lower than FY16’s 5.2 percent.
Mixed Results Over Time
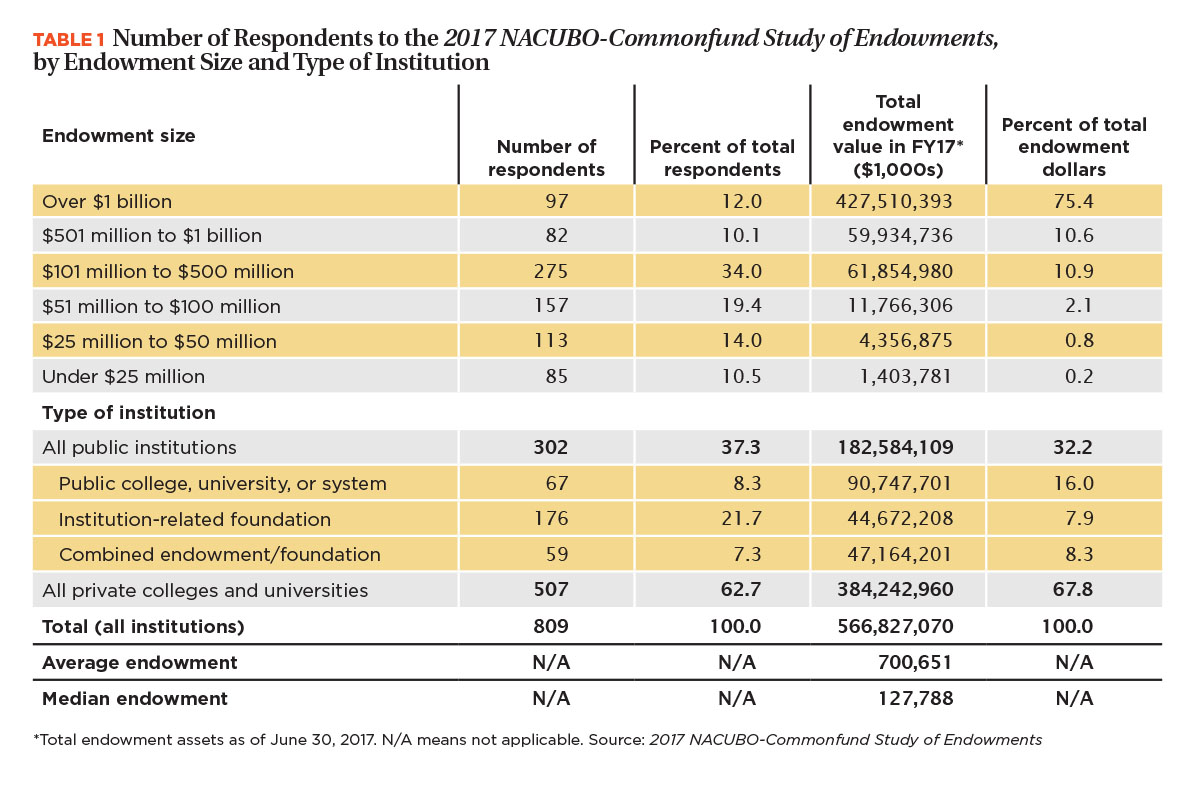
The 809 U.S. colleges, universities, and affiliated foundations that participated in the 2017 NCSE (more than the previous year’s total of 805 respondents) held more than $566 billion in endowment assets as of June 30, 2017 (see Table 1). Twelve percent of responding institutions reported endowments of $1 billion or more, accounting for three-quarters of 2017 NCSE participants’ total endowment dollars.

On the opposite end of the scale, close to 11 percent of responding institutions reported total endowments of under $25 million—less than 1 percent of total endowment dollars. The average endowment of all participating institutions was more than $700 million; the median endowment was almost $128 million. Close to 44 percent of the responding institutions had less than $100 million in endowment assets.
In a dramatic upswing from uniformly negative one-year returns in FY16 and low returns in FY15, college and university endowments for institutions participating in the 2017 NCSE posted average positive returns across the board in FY17 (see Table 2). The largest endowments reported a 12.9 percent average return compared with –1.9 percent in FY16; this was the largest reported average return in FY17. Institutions with endowments between $501 million and $1 billion reported the second-largest return in FY17, 12.7 percent (up from –2.2 percent in FY16), followed closely by institutions with endowments between $101 to $500 million (12.5 percent return compared to –2.4 percent in FY16). Institutions with the smallest endowments (under $25 million) reported the smallest average return, 11.6 percent, up from –1.0 percent in FY16.

Although this one-year return is strikingly positive for all endowment sizes, the longer-term returns that endowment managers use to plan spending and investments are mixed. Overall average five-year net returns in FY17 were 7.9 percent as opposed to 5.4 percent in FY16. However, looking at FY17 average 10-year net returns, both overall (4.6 percent, lower than FY16’s 5.0 percent) and by endowment size, tell a different story. The smallest endowments (under $25 million) reported no difference between FY16 and FY17 10-year net return (5.0 percent for both years). All other endowment sizes reported lower average 10-year net returns in FY17 than in FY16, with the largest endowments dropping from 5.7 percent average 10-year net return in FY16 to 5.0 percent in FY17. Since endowment performance over time is crucial to responsible fiscal stewardship, this long-term trend bears watching.
Stable Asset Allocations
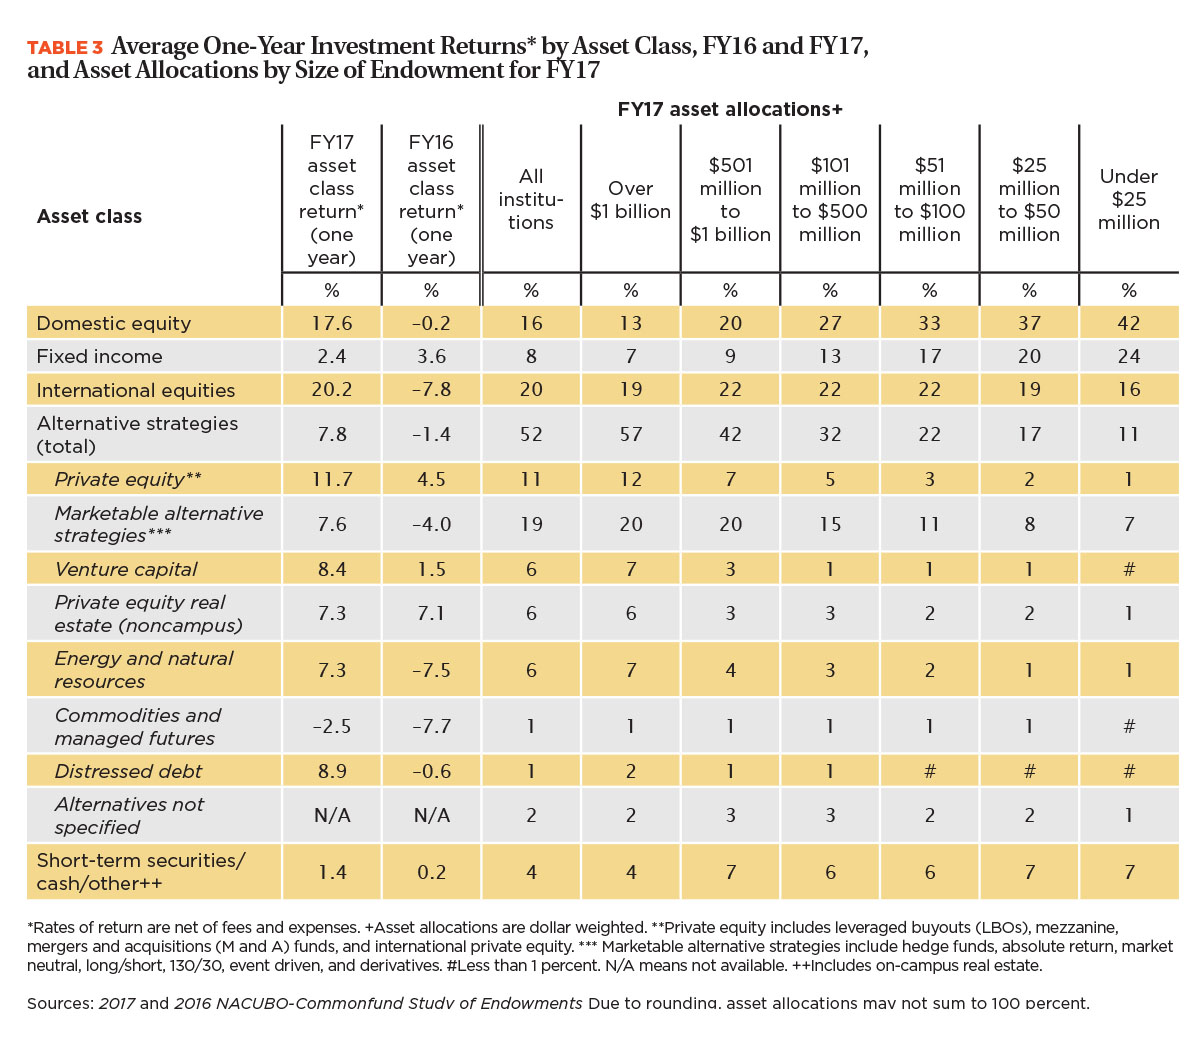
Asset allocations remained largely stable between FY16 and FY17, despite FY17’s turbulent world events. The dollar-weighted average shares of endowment assets invested in U.S. equities (16 percent), fixed income (8 percent), and cash/short-term securities (4 percent) did not change from FY16 (see Table 3). International equities rose by one percentage point, from 19 to 20 percent, and assets in alternative strategies fell by one percentage point, from 53 percent to 52 percent.
While asset allocations remained largely unchanged in the past two surveys, FY17 one-year investment performance rose rapidly from FY16 in a number of asset classes. For example, U.S. equities went from a –0.2 percent return in FY16 to 17.6 percent return in FY17. International equities also rebounded from a –7.8 percent return in FY16 to a 20.2 percent return in FY17. Energy and natural resources pulled out of its two-year negative return pattern, moving from –7.5 percent in FY16 to 7.3 percent in FY17. However, performance was not unilaterally positive; fixed incomes fell from a 3.6 percent return in FY16 to 2.4 percent in FY17, and commodities and managed futures remained in negative return territory, though the –2.5 percent return in FY17 improved from the –7.7 return in FY16.

Increased Endowment Spending
Despite the lower long-term endowment returns, 65 percent of institutions increased their endowment spending dollars in FY17, and the average increase in spending dollars among these schools was 6.5 percent—far in excess of the rate of inflation. In addition, institutions slightly increased their average effective endowment spending rate from 4.3 percent in FY16 to 4.4 percent in FY17. More than three-quarters of schools with the largest endowments (over $1 billion) increased their spending dollars, and the median spending rate among these institutions rose to 4.8 percent in FY17 compared with 4.4 percent the year prior.
Another aspect of endowment spending that should be taken into account is special appropriations; in FY17, 26 percent of institutions made special appropriations to spending, with an average 2.2 percent above their spending rate represented by these special appropriations. Notably, the largest area of special appropriations was to support institutional operating budgets. Other data on endowment spending and operating budgets include the median percentage of operating budget funded by endowment; in FY17, this decreased to 2.5 percent from 4.0 percent in FY16. Considering all three categories of data holistically—average effective endowment spending rate, special appropriations, and median percentage of operating budget funded by endowment—is important to understand long-term implications related to endowment spending and institutional operating budgets.
Policies With Purpose
A component of endowment policy further discussed in the article “Investing With a Purpose” are environmental, social, and governance (ESG) investment criteria. These evaluate a company’s or institution’s environmental policies, relationship with its surrounding community, and governance, including such topics as shareholder governance and transparent accounting. This differs from socially responsible investing (SRI), which focuses on excluding investments deemed to have negative impacts on social welfare.
The NCSE collects some data on institutions’ ESG and SRI policies and investments. For instance, in FY17, 16 percent of all responding institutions sought to include investments in their endowment portfolios that ranked highly on ESG criteria, and 23 percent of institutions excluded or screened out investments deemed inconsistent with the institution’s mission. Also, 32 percent of responding institutions indicated that they had met with third-party stakeholders, including faculty, staff, students, and/or board of trustee members, regarding responsible investment considerations.
However, free response comments grappled with the tension between college and university endowment managers’ fiduciary responsibility to generate enough endowment income to sustain their institutions in perpetuity and the socially responsible use of ESG or SRI investment criteria to limit investments. One respondent stated, “Our policy is to make the best fiduciary decision for the endowment.” Another commented, “It is important to recognize that the university has a moral and fiduciary responsibility to pursue a reasonable rate of return, with appropriate diversification and risk, on its portfolio in order to support its mission and goals. Within this context, the committee will consider factors other than investment return in its investment choices in order to reflect the university’s social and ethical principles, and will take proactive steps to invest in ways that are consistent with these principles wherever reasonably possible.” A number of institutional respondents explained that parts of their portfolios (e.g., commingled funds) by nature do not permit the application of ESG or SRI criteria, but they use separately managed ESG funds or SRI funds that allow them to exclude certain investments (e.g., tobacco products or fossil fuel companies).
Future Volatility?
The passage in late 2017 of the Tax Cuts and Jobs Act, with its combination of changes to the standard deduction and a new 1.4 percent excise tax on certain private college and university endowments, may alter the higher education philanthropy landscape in ways that remain to be seen. For more information on The Tax Cuts and Jobs Act and institutional stories regarding its potential effect, visit www.nacubo.org, click on the “Topics” tab, and then click on “Tax.”
The endowment tax provision applies to taxable years beginning after Dec. 31, 2017. Private institutions subject to the 1.4 percent excise tax on their endowments’ net investment income must have at least 500 students and “assets (other than those used directly in carrying out the institution’s educational purposes) valued at the close of the preceding tax year of at least $500,000 per full-time student.” For the NACUBO summary, visit www.nacubo.org and click on “Tax” under the “Topics” tab. While this provision likely will only affect a small number of institutions with very large endowments according to current information, the step of taxing private institutions’ endowment income at all is unprecedented.
According to the Joint Committee on Taxation summary, examples of assets that would be considered as used directly to carry out the institution’s exempt purpose would include classroom buildings, physical facilities used for educational activities, and office equipment. However, at press time, regulations have yet to be determined, so the full impact is unclear. Further, John Walda, president and CEO of NACUBO, stated on Dec. 18, 2017, that, “the new excise tax on college and university endowments means that there will be fewer dollars available for scholarships, student services, research, and college and university operating expenses, raising costs for affected institutions and working against affordability. Doubling the standard deduction without creating another charitable giving incentive will likely slow the giving that supplements resources for colleges and universities—and all nonprofit organizations.”
Thus, while one-year FY17 net endowment returns rebounded significantly from the negative, the combination of lower 10-year net returns, and the unknown effects of provisions in The Tax Cuts and Jobs Act, weigh heavily on endowment managers. It is prudent to proceed with caution; it remains to be seen in which direction the long-term trends will swing in FY18 and beyond.
LESLEY MCBAIN is assistant director of research and policy analysis, NACUBO.


