The average tuition discount rate has long been a measure of an institution’s ability to remain competitive in the marketplace. It is the core metric that business officers from similarly situated (private, independent) colleges and universities want to gauge. Measured as the share of gross tuition and fee revenue represented by institutional grants, the percentage discount essentially quantifies the amount of gross tuition and fee revenue the institution chooses to forgo in an attempt to maintain enrollment goals.
One of the key purposes for discounting tuition is to attract and retain students who might otherwise be unwilling or unable to pay the full sticker price to attend a particular college or university. That discount rate has increased every year since 2005, when it was 38.0 percent for first-time, full-time freshmen.
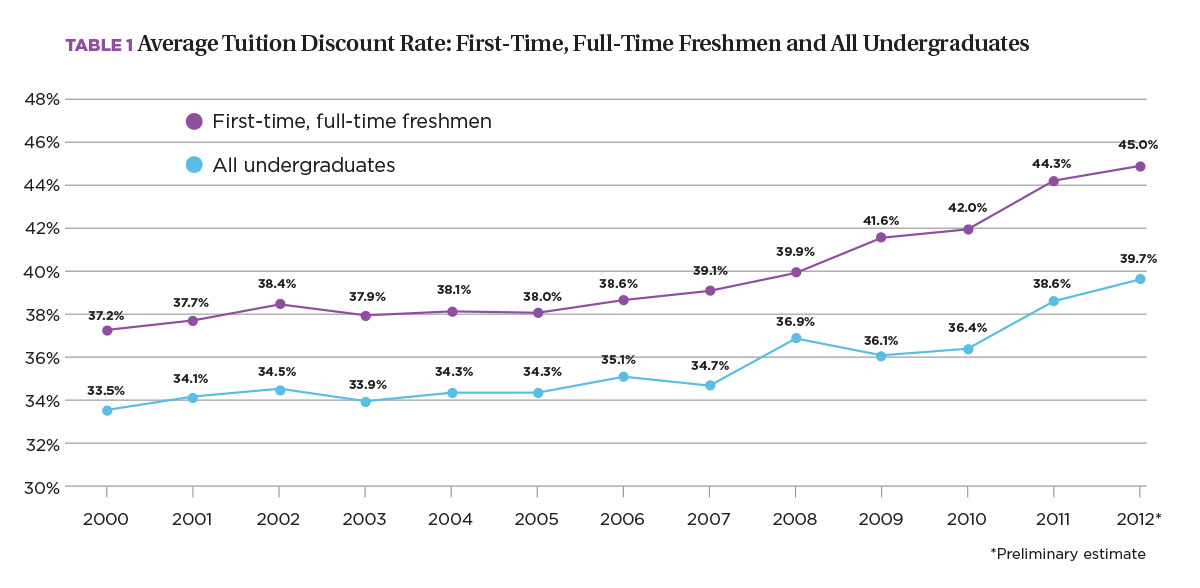
The 2012 NACUBO Tuition Discounting Study (TDS), which reports discount data for the 2011–12 academic year as of fall 2011 and preliminary estimates for the academic year 2012–13 as of fall 2012, shows an especially large increase in the discount rate from 2010 to 2011. At 2.3 percentage points of growth, that number put institutions beyond last year’s prediction for 2011, landing them at 44.3 percent on average. Further, the discount rate for this group is estimated to have swelled to 45 percent for 2012. (See Table 1 for detailed data from 2000 to 2012.)
At its highest level ever, the discount rate overall still failed, at many schools, to attract sufficient enrollment to meet target numbers. One way to interpret the numbers? Price sensitivity has hit higher education in a big way, as student and family resources continue to decline. Following is an analysis of the 2012 TDS data and some implications for the future.
Discounts Reflect Supply and Demand
Why is there such a significant increase in the discount rate between 2010 and 2011? While the Great Recession had largely subsided, the downturn gave way to a weak recovery accompanied by falling wages and a depressed net worth for the average American family that made for rethinking the amount of resources to devote to a college education.
The U.S. Federal Reserve’s Survey of Consumer Finances for 2010, released in 2012, found that the average median value of inflation-adjusted pretax income fell 7.7 percent from 2007 and 2010, while median net worth of families dropped 38.8 percent. These factors, along with falling enrollment at some schools—and achievement of enrollment targets at other schools accomplished only because of the use of discounting—have led to the upward tick of discount rates that have reached new highs. Such volatile demand plays a large role in determining an institution’s discount rate and its overall financial health.
Obviously, enrollment is one pillar of several that hold up the higher education business model. Students are the lifeblood of colleges and universities, and the changing nature of student enrollment is of great concern to institutions, especially those that have seen an unwelcome drop in numbers, forcing them to provide much more financial assistance in order to better the chances of meeting enrollment goals.
Of course not all institutions are suffering from falling demand. And the business model where demand is high looks much different from that experienced by demand-challenged colleges and universities.
In fact, the TDS highlights two distinct types of institutions: those with solid demand, and those where the institution’s ability to attract sufficient students is weakening.
Attraction up. At institutions that gained enrollment over the past three years, one third of participating CBOs attribute the bump to increased demand for the institution. Another third said that new programs and/or the institution’s facilities were reasons for the growth. Among “other” reasons noted were (1) increasing financial aid packages; (2) improved marketing, branding, and recruiting efforts; and (3) new athletics programs.
Schools in this category aren’t as confined in setting their sticker prices, and many students are willing to pay full price because they want to attend. Interestingly, 34.6 percent of institutions chose to lower their discount rate in 2012 from 2011. One institution reports: “We plan to slightly reduce our financial aid discount in the coming years. We recognize the challenge associated with that goal, as families’ incomes (on average) are just now beginning to recover from the recession. The challenge is exacerbated as we watch state aid to students decline in spite of their reduced ability to help contribute toward the cost of their education.”
Demand down. The reverse situation is often the case for colleges and universities where demand is waning: The discount rate may need to be raised in order to reach the price needed to fill seats, or to meet the financial need of those unable to pay full fare.
Many institutions struggle to find the right balance necessary for remaining affordable while still generating sufficient net tuition revenue to offset education and general (E&G) expenses. One TDS participant explains, “We implemented a nominal tuition increase to balance the university’s financial requirement with the affordability of our families. Secondly, due to the economic pressures on our students and families that is being seen through[out] the higher education industry, we increased our budgeted institutional aid discount rate. …”
While some institutions are trying to hold the line or reduce unsustainable discount rates, they are often met with the challenge of losing enrollment. Says one survey participant: “We attempted to decrease our discount rate. We were not successful and ended up enrolling slightly [fewer] students than desired with a discount rate slightly higher than desired.”
Enrollment Estimates, Influences
Many factors contribute to this loss of student enrollment, including a decline in the 18- to 24-year-old population, regional/statewide changing demographics, price sensitivity on the part of students and families, economic factors, shifting public opinion about the value of a college degree, student indebtedness, and inability to find a job after graduation.
In fact, “Nearly half of all universities are reporting lower enrollment for fall 2012 … enrollment declines are concentrated in colleges with smaller enrollment size, high tuition dependence, weak selectivity/yield rates, and soft regional demographics,” noted Moody’s Investors Services, in its January industry outlook report, “U.S. Higher Education Outlook Negative in 2013.” Last year, the results of NACUBO’s 2011 Tuition Discounting Study also documented this trend among undergraduates at independent colleges and universities.
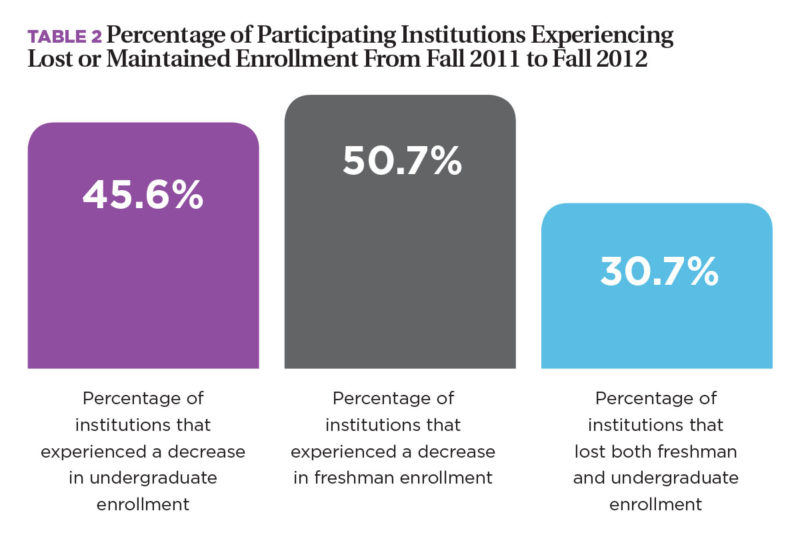 Similarly, the 2012 TDS reported that approximately half (50.7 percent) of participants experienced declines or “no increase” in their first-time, full-time freshmen enrollment from the year before, while 45.6 percent reported a similar trend for total undergraduate enrollment. (See Table 2 for details.) Nearly one third (30.7 percent) of respondents saw declines in both first-time freshmen and total undergraduate enrollment.
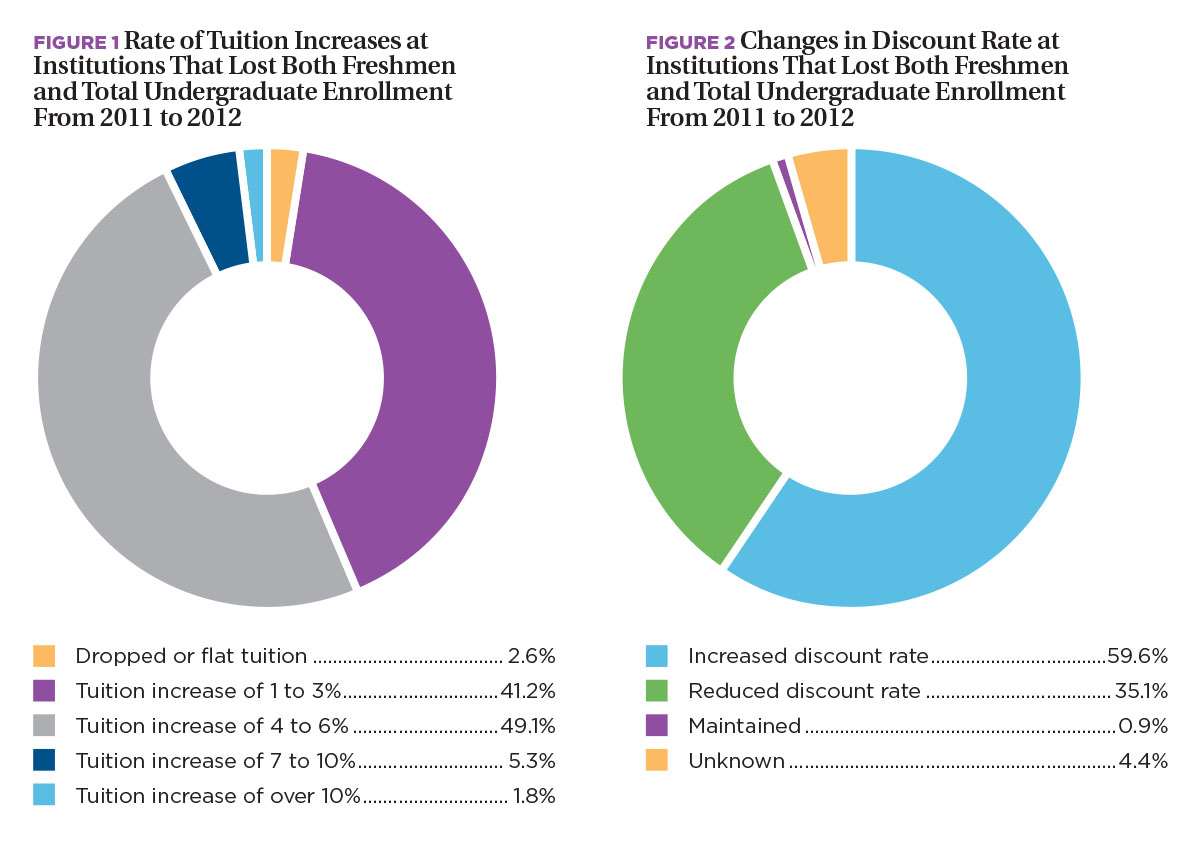
A deeper look into the institutions that made up the 30.7 percent of institutions that lost both freshmen and undergraduate enrollment shows that 56.2 percent of them had increased tuition by over 4 percent from 2011 to 2012; 41.2 percent had raised tuition by 1 to 3 percent; and 2.6 percent of institutions that lost enrollment had reduced tuition or held it flat. (See Figure 1.)
In terms of changes in the discount rate, 35.1 percent of institutions that lost both freshmen and all undergraduate enrollment had reduced their discount rates from 2011 to 2012. (See Figure 2 for details.)
All types of institutions comprise the population of institutions with declining enrollments. Small institutions made up the largest share (83.4) percent, noting a loss in total undergraduate enrollment; comprehensive/doctoral institutions represented 11.8 percent of the institutions reporting lost or maintained undergraduate enrollment; while research institutions represented 4.7 percent.
A new question in the 2012 Tuition Discounting Study focused on projected reasons why enrollment was changing—whether dropping or growing. CBOs at institutions that have lost students over the past three years were asked what might have influenced the decrease. Nearly 50 percent reported that “price sensitivity” was the underlying reason for the enrollment drop; 32.5 percent reported that some other reason was at play.
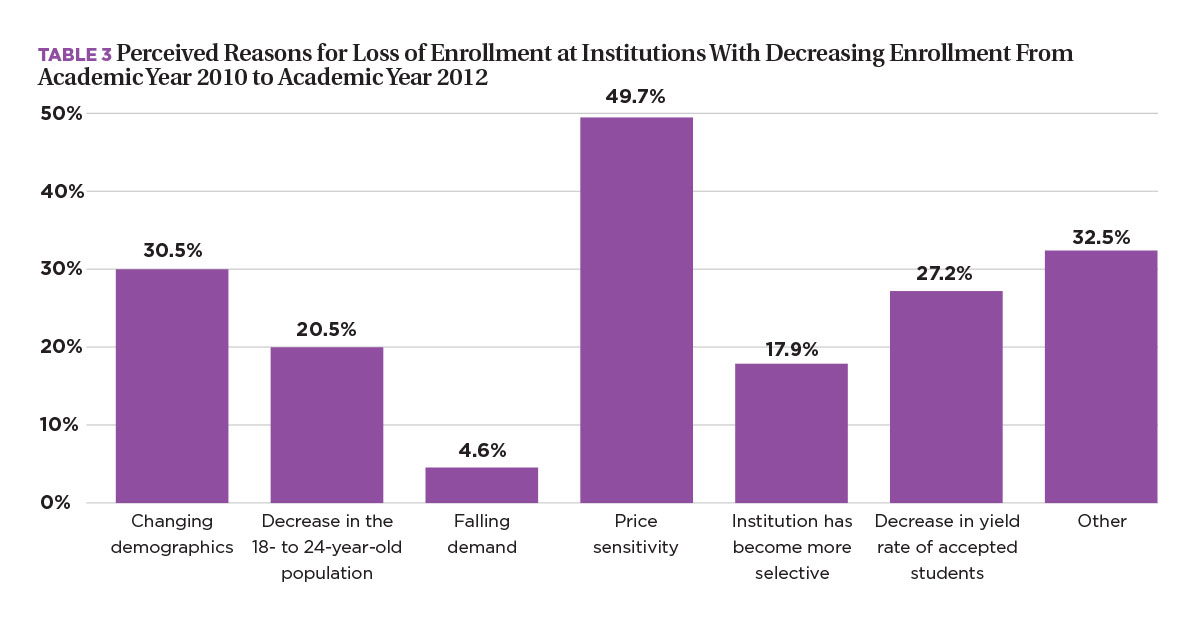
Many of the responses considered “other” related to price sensitivity, including “economic conditions, ” “affordability,” and “students shopping around for the best aid package.” Changing demographics, specifically the decrease in the 18- to 24-year-old population, were also factors for many institutions; 27.2 percent reported that their yield rate of accepted students was the source of the decline. Approximately 18 percent reported that their institution was purposefully becoming smaller to be more selective. (See Table 3 for details.)
Net Revenue Impact
When a college or university discounts too deeply in order to meet its enrollment goals, it can mean that the institution will not raise enough tuition revenue to cover the cost of educating all students. In this case, the institution’s leaders must decide which other sources of support it might draw on to fund operations. Other revenue sources vary by institution but often come from donations, auxiliaries, and reserves. Generally speaking, an institution operating in this way is considered unsustainable, since net tuition revenue is declining, eventually causing a budget shortfall.
Some institutions in the 2012 TDS did report unsuccessful outcomes—failing to increase enrollment and, as a result, not meeting net tuition revenue goals. “We tried to increase net tuition revenue by enrolling more students on campus with increasing the amount of financial aid offered,” notes one participant. “Our strategy was not successful, as we saw a drop in overall yield even with an increase on our first-year discount.” Another remarks, “The institution attempted to increase new tuition revenue by increasing enrollment; however, those efforts were not successful and we experienced a large summer melt that was larger than our past data would have predicted.”
In terms of net tuition revenue per student, the average annual change is a useful analysis to determine whether the institution is generating more money per student from year to year. Ideally, tuition revenue covers the cost of delivering an education to the student. However, higher education is facing rising costs in delivering educational services because of faculty salaries and benefits (which includes health insurance), updating facilities, investing in technology, mounting costs of building maintenance, supplies, and other services, and so on.
Negative net tuition revenue is the predictable result when institutions discount very deeply and generate less revenue per student than they did the year before. In 2011, the boom in growth in the freshman discount rate (see Table 1) had that related effect on net tuition revenue for private, nonprofit institutions. Because of the large increase in institutional grant dollars awarded, the change in net tuition revenue per freshman fell –.28 percent on average, as noted in Table 4.
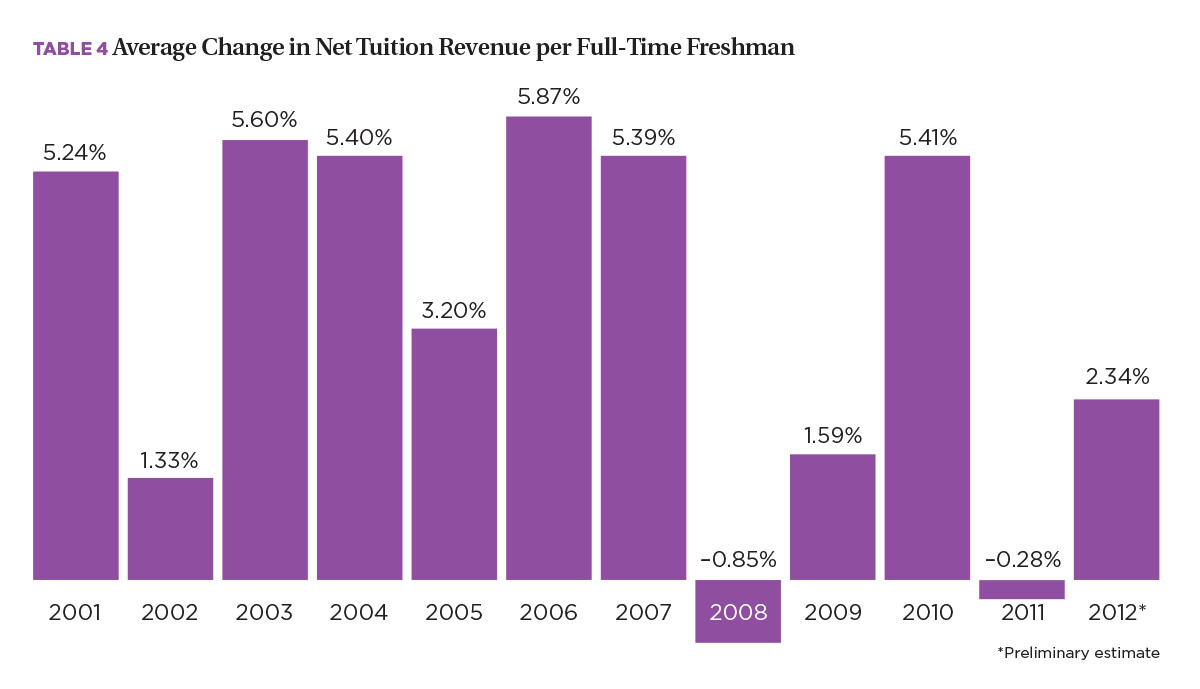
While net tuition revenue estimates for 2012 show an increase of 2.34 percent, the past five years have been something of a roller coaster; and when considering trends in enrollment and the discount rate, it does not appear institutions will be returning to the prerecession average change in net tuition revenue (of nearly 5 percent) anytime soon.
The January 2013 Moody’s Investor Service report notes, “The [higher education] sector will need to adjust to the prospect of prolonged muted revenue growth. … Families remain willing to pay for college but their capacity to pay higher prices has been largely tapped and has dramatically dampened the sector’s capacity to grow tuition revenue.” When the net tuition revenue dollars are adjusted for inflation using the Higher Education Price Index (HEPI), the change in net tuition revenue looks quite flat. In fact, over the past 12 years, there has only been a 1.1 percent increase in net tuition revenue in constant dollars.
For institutions that have exhausted enrollment, the amount they can charge for tuition and fees, and the aid they can offer, they must rely on other sources of support to cover their E&G expenses. This support can come from revenue generated from endowment spending and other gifts; auxiliaries (e.g., food service programs, bookstores, parking, dormitories); and other unrestricted public support sources—or from taking on increased debt.
One survey participant perhaps summarizes best the findings of the 2012 TDS: “It gets harder every year.” Indeed, there are many indicators that the business model higher education has relied on for many years may have to change—especially at those colleges without diverse revenue streams. Private, nonprofit colleges and universities are facing a challenging environment in the years to come and will continue to seek the right balance among pricing, enrollment, and discounting in order to provide a high-quality postsecondary education and fulfill their missions.
NATALIE PULLARO DAVIS, manager, research and policy analysis, NACUBO


